D2L
DESIGN SYSTEMS
ACCESSIBILITY
Overview
Brightspace’s Insights Portal is an in-house data visualization solution that provides a full picture of users across an educational institution to allow faculty to measure various metrics, such as engagement and learner progress. Despite the growing reliance on LMS analytics to provide information about learners, there is still a large learning and understanding curve among less data-savvy users.
Solution
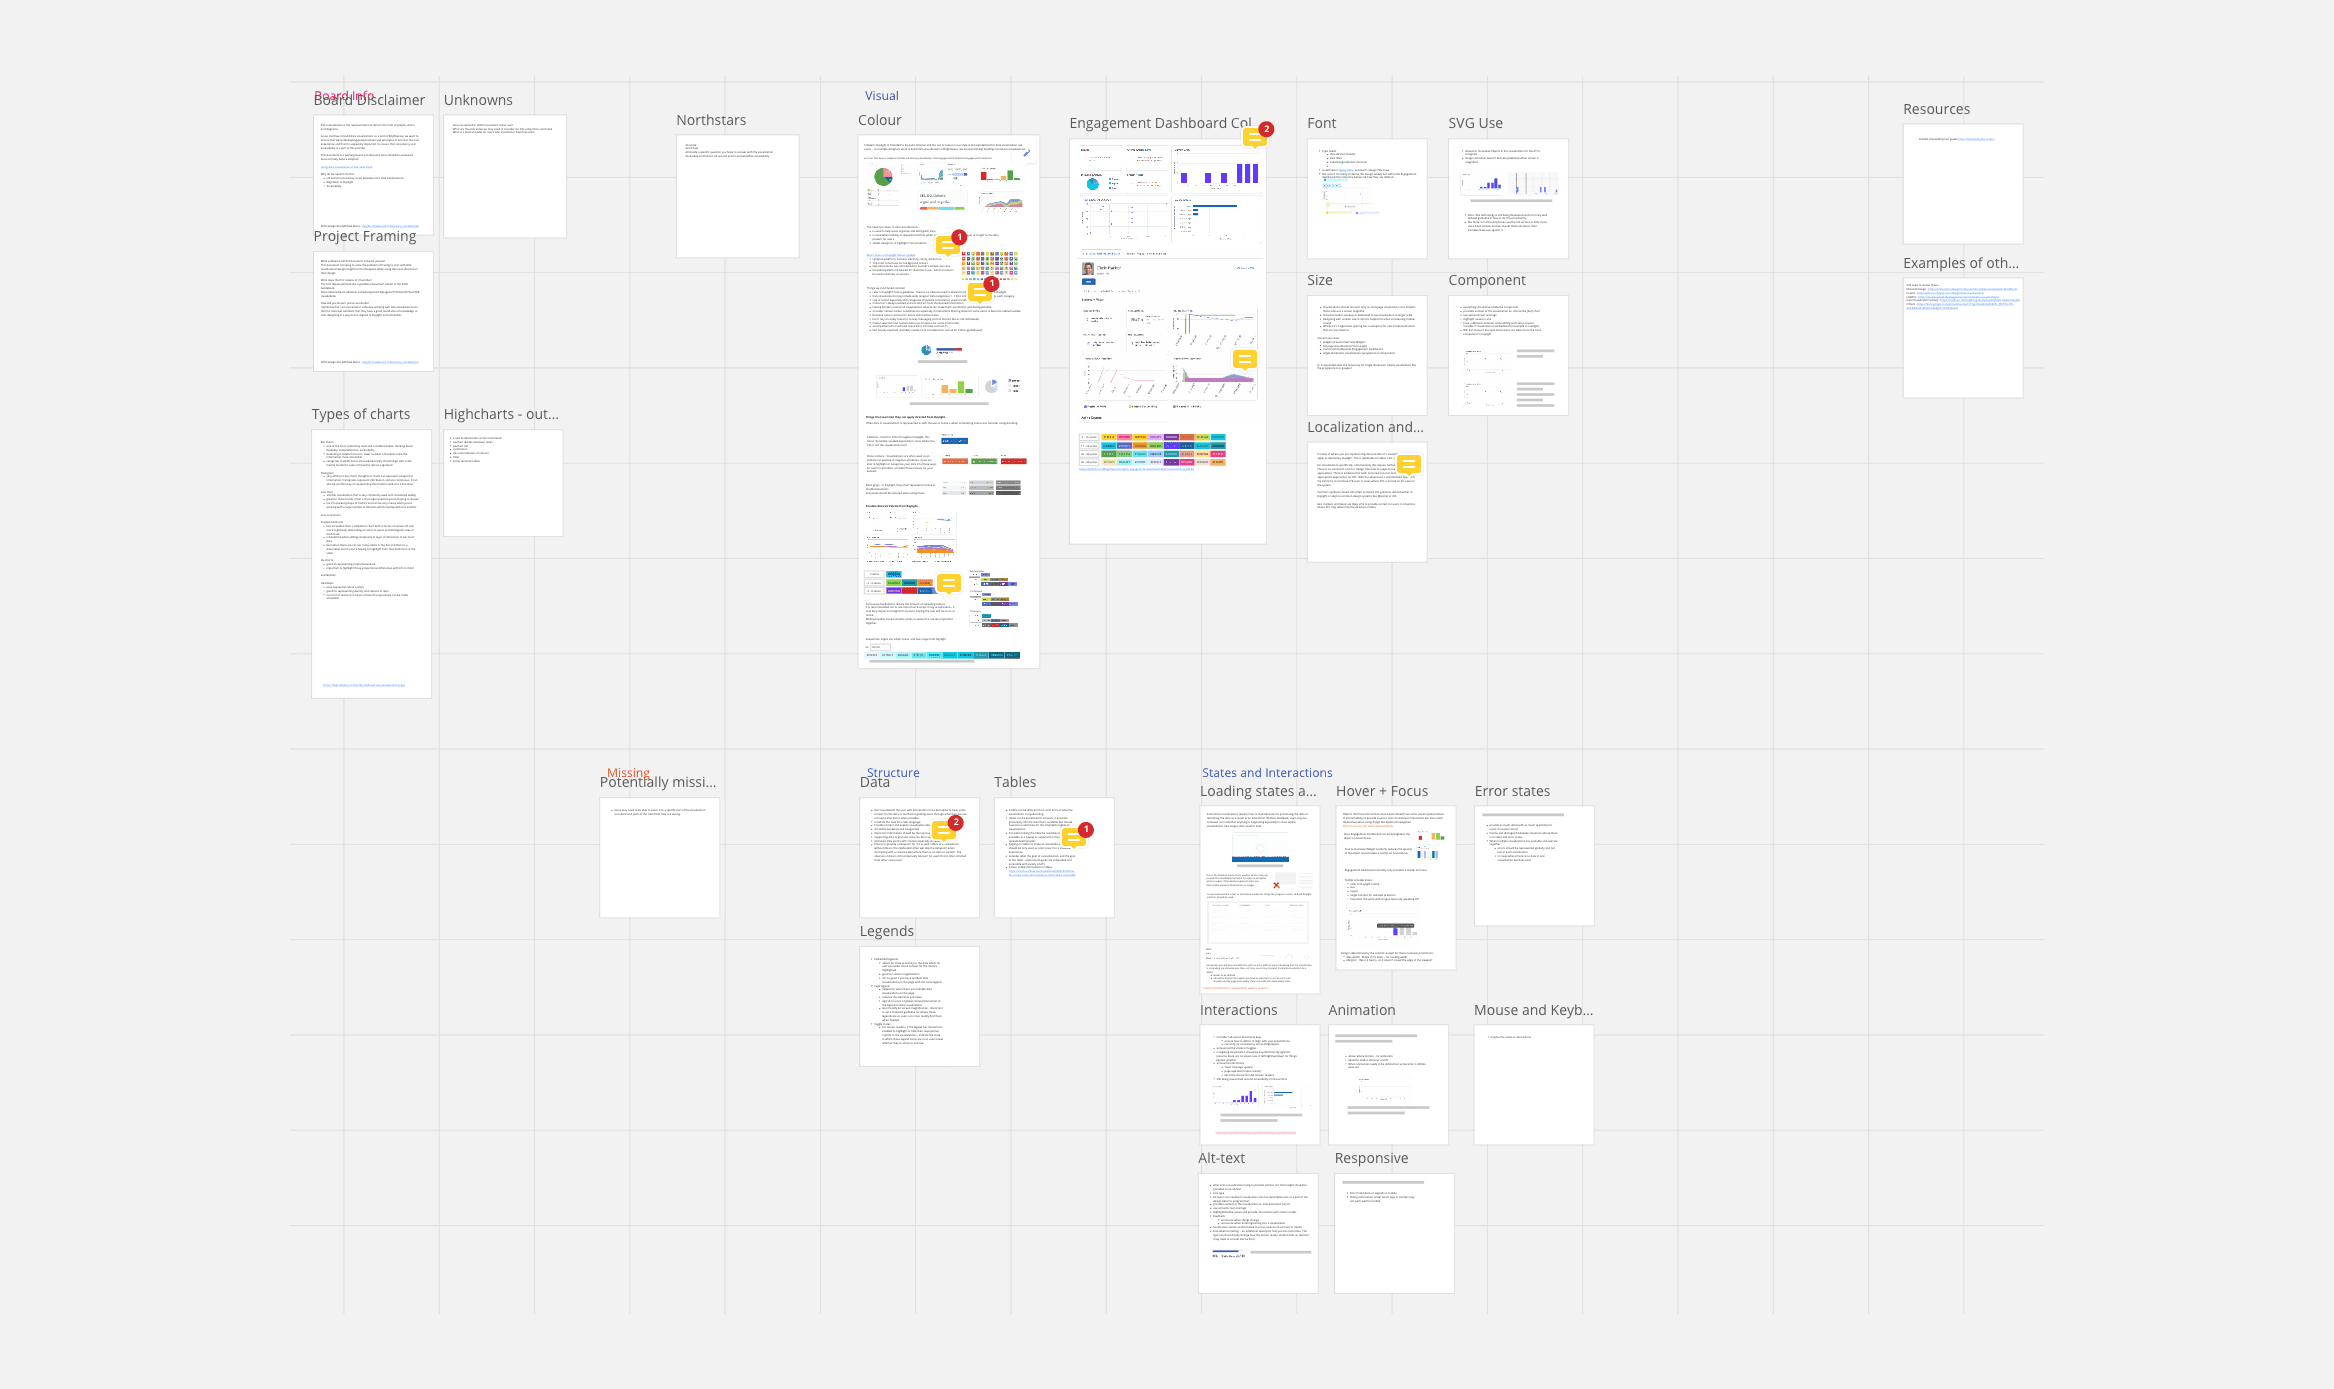
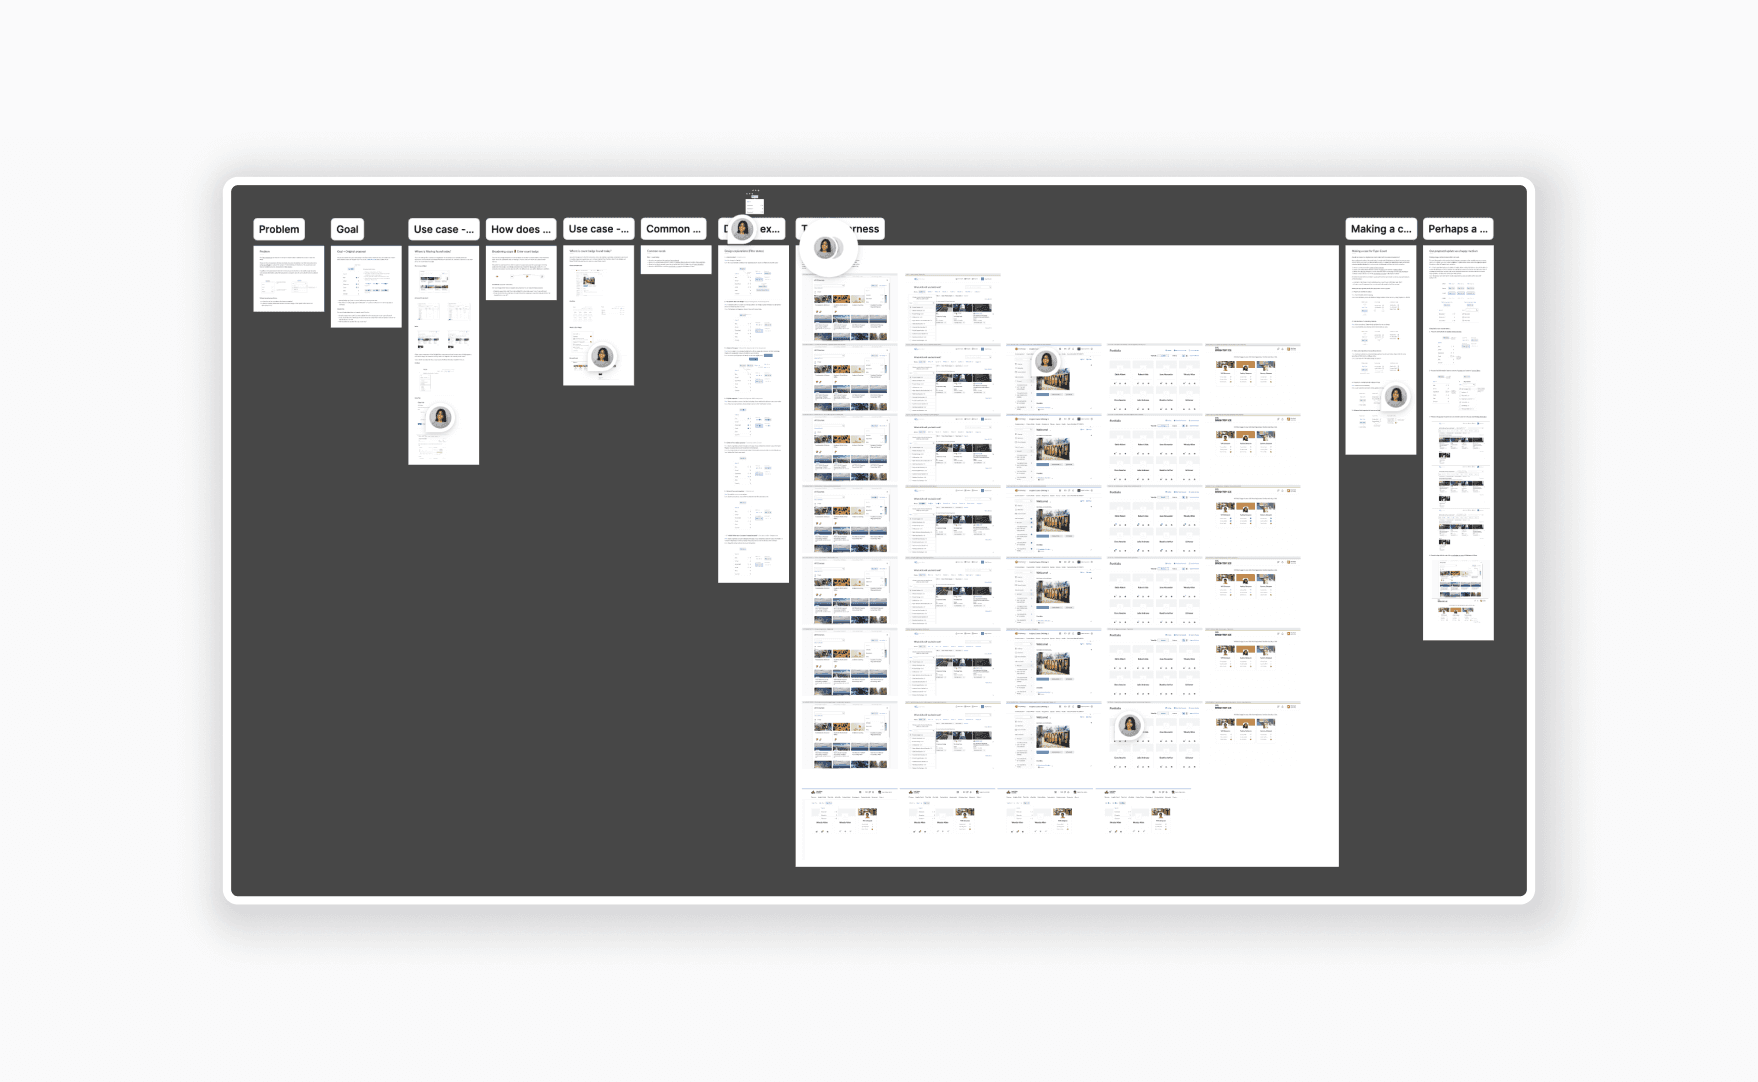
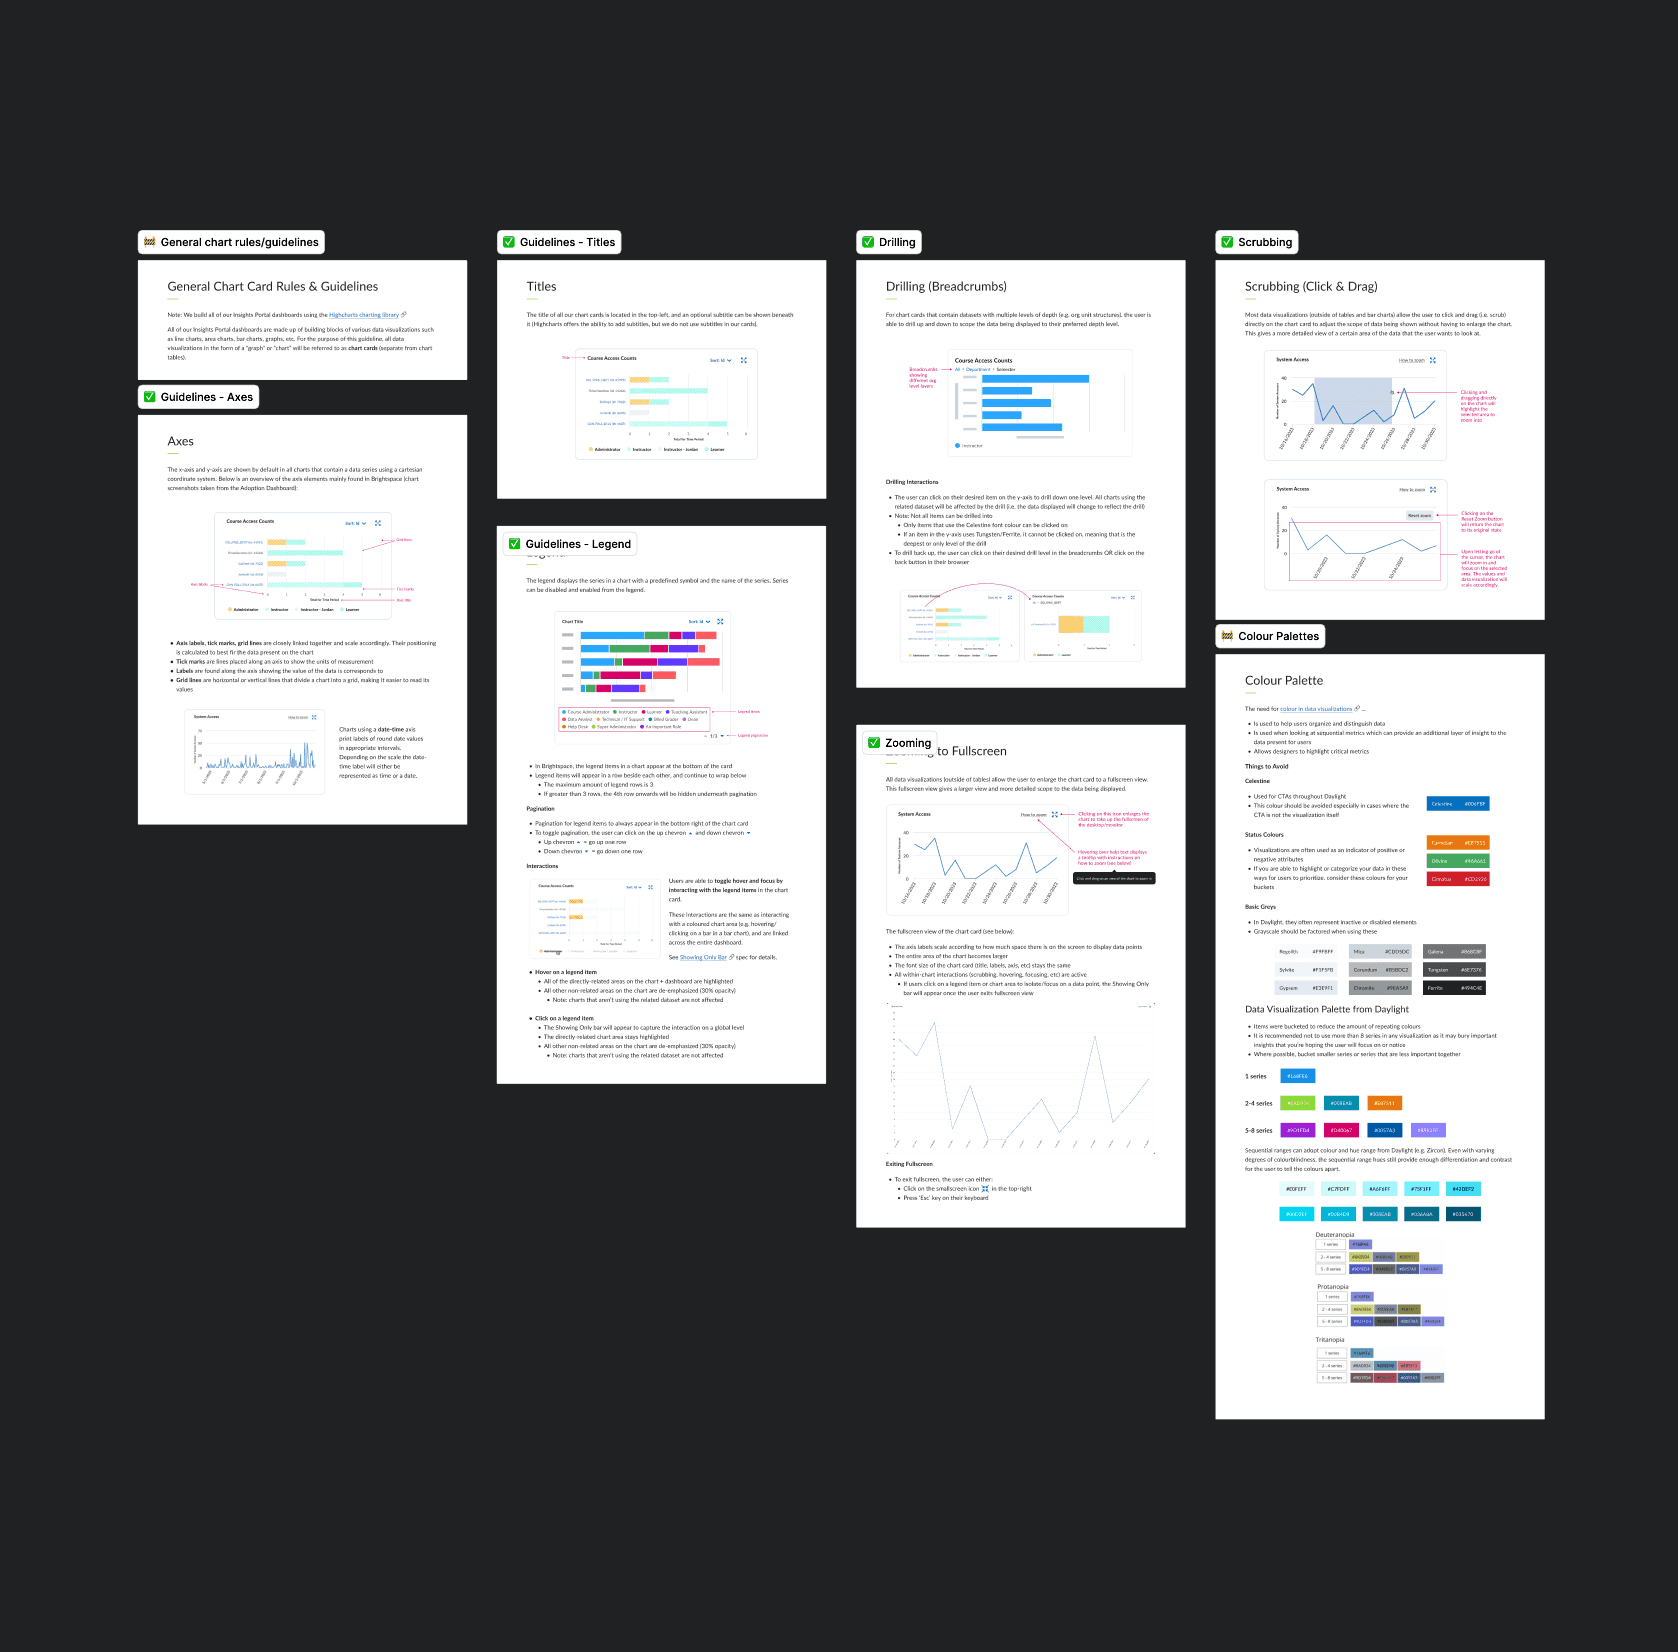
We established a platform-wide analytics framework to ensure consistency, clarity, and ease of use across all faculty dashboards. Through accessibility reviews, usability audits, and the creation of a reusable charting library and data-visualization design system, we created patterns that scale and support future analytics initiatives while improving insight-gathering for administrators.
Results & Impact
After internal and external usability validation, our new analytics framework reduced the learning curve for faculty administrators, enabling them to interpret data with greater confidence and speed. By improving usability and accessibility across dashboards, we strengthened the value of our in-house analytics solution and reinforced its position as a key market differentiator while increasing overall product desirability.
Read more about Brightspace Insights here. If you’re interested in a deeper walkthrough or additional context, feel free to reach out.